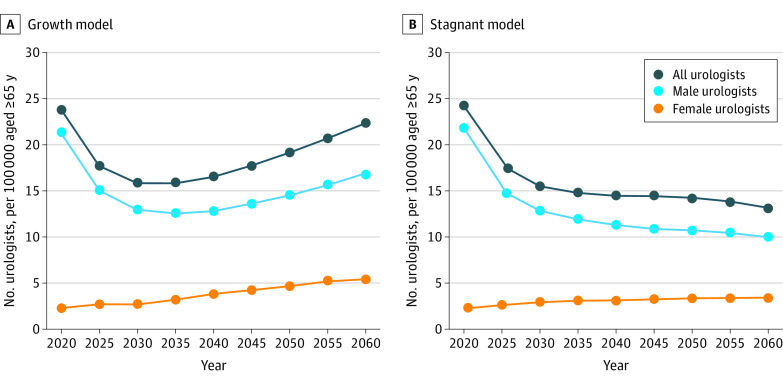
Figure 2. Projected Number of Urologists per 100 000 People Aged 65 Years or Older From 2020 to 2060.
A, Graph shows projected number of urologists under the continued 13.8% growth stock and flow model. B, Graph shows projected number of urologists under the 0% stagnant growth stock and flow model. In both panels, each dot represents the number of urologists per 100 000 persons aged 65 years or older corresponding to the year.

