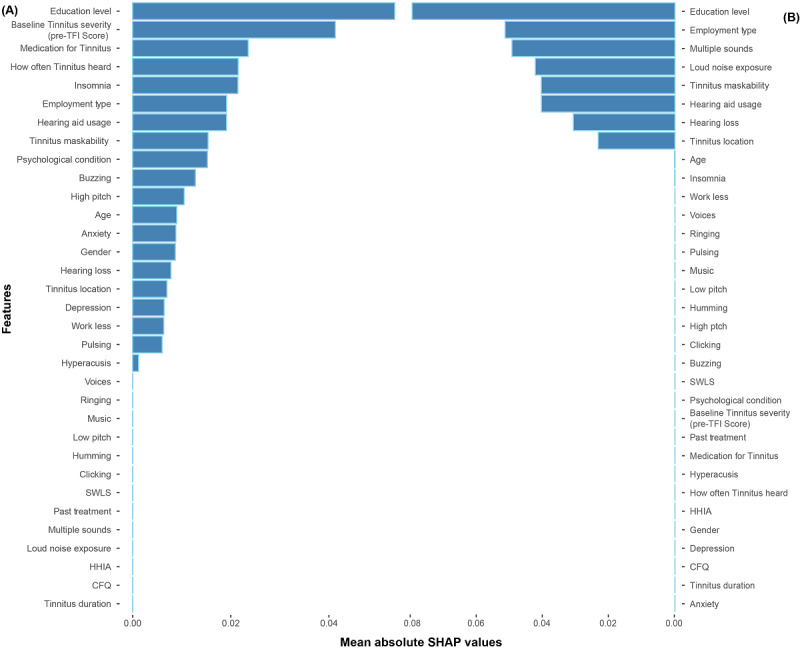
Figure 1.

Feature importance based on the mean absolute SHAP values from (A) the best gradient model and (B) from the best classification and regression tree decision tree model. These SHAP values represent the absolute change in log odds. Relatively higher importance is indicated with larger SHAP values. CFQ: Cognitive Failures Questionnaire; HHIA: Hearing Handicap Inventory for Adults; SHAP: Shapley additive explanations; SWLS: Satisfaction with Life Scales; TFI: Tinnitus Functional Index.
