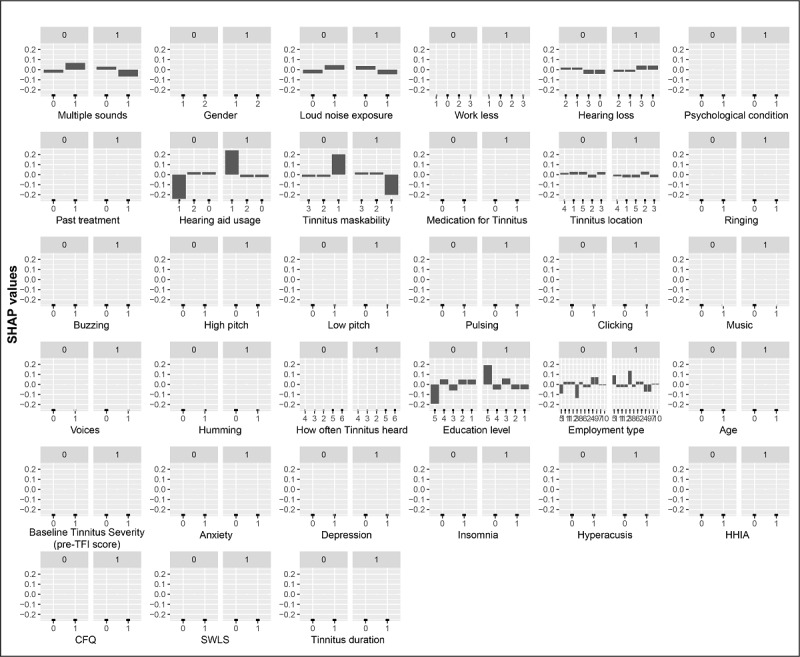
Figure 3.

The best classification and regression tree decision tree model feature effects. Each graph represents a feature vs. corresponding SHAP value. Plots with “1” represent the effect that each feature has on achieving a successful treatment outcome. CFQ: Cognitive Failures Questionnaire; HHIA: Hearing Handicap Inventory for Adults; SHAP: Shapley additive explanations; SWLS: Satisfaction with Life Scales; TFI: Tinnitus Functional Index.
