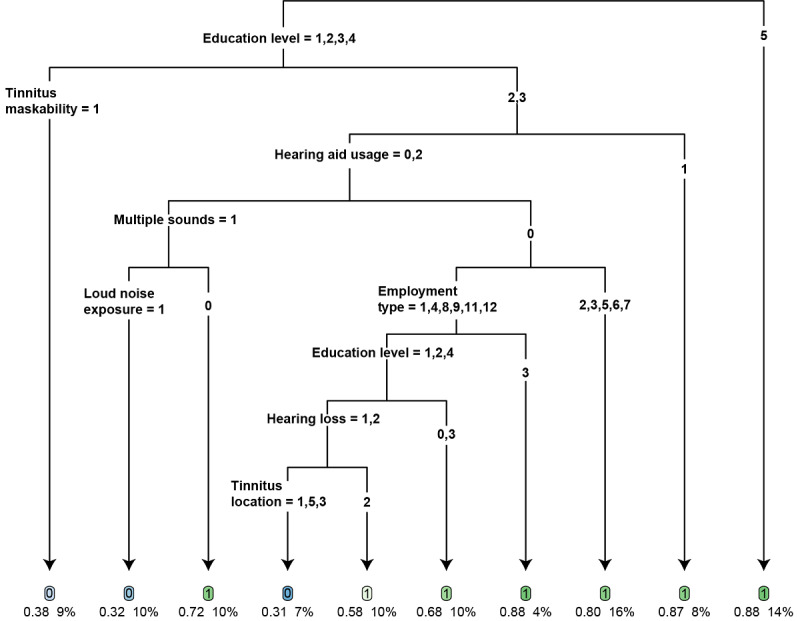
Figure 4.

The best classification and regression tree decision tree model. The fitted tree has 10 terminal nodes (denote the decision criteria). The variable categories (please refer to Multimedia Appendix 2 for variable category labels) corresponding to each split are given at the top of each branch. Each terminal node contains the predicted treatment class ("1" indicates the successful treatment class and "0" indicates the unsuccessful treatment class), the percentage of subjects with successful treatment outcomes, and the percentage of participants with the given characteristics in the training set.
