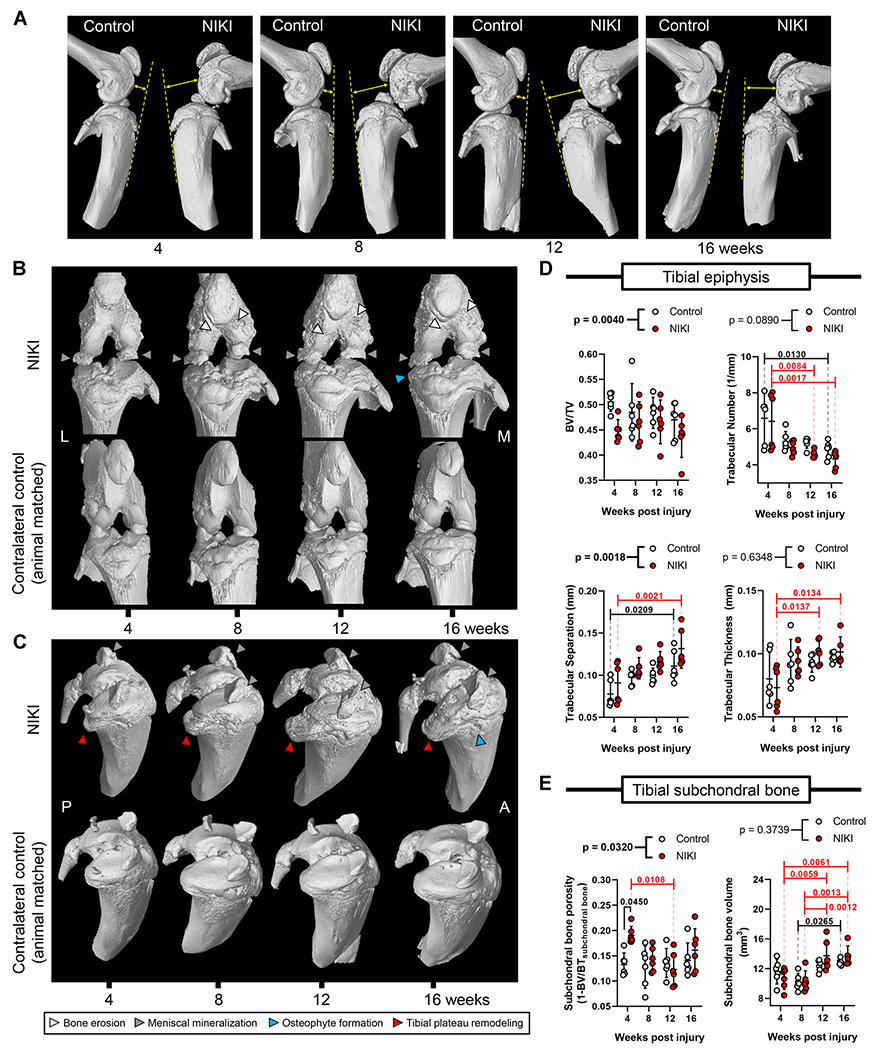
Figure 3.

Bone structure and morphometric parameters by nanoCT. (A) Relative anatomical orientation of the femur and tibia. The dotted line is drawn along the anterior tibia with the arrow illustrating the positioning of the femur with respect to that line. (B) Anterior view of the knee and (C) view of the tibial plateau of the same knee. Images for 3D reconstructions are animal-matched between NIKI and control and were selected as representative based on the severity of tibial plateau remodeling. Morphometric analysis for the (D) tibial epiphysis and (E) tibial subchondral bone over time. p-Values above graphs = two-way analysis of variance treatment effect (NIKI vs. control); p-values within graphs = Tukey’s multiple comparisons. M = medial, L = lateral, P = posterior, A = anterior. [Color figure can be viewed at wileyonlinelibrary.com]
