
Figure 5.
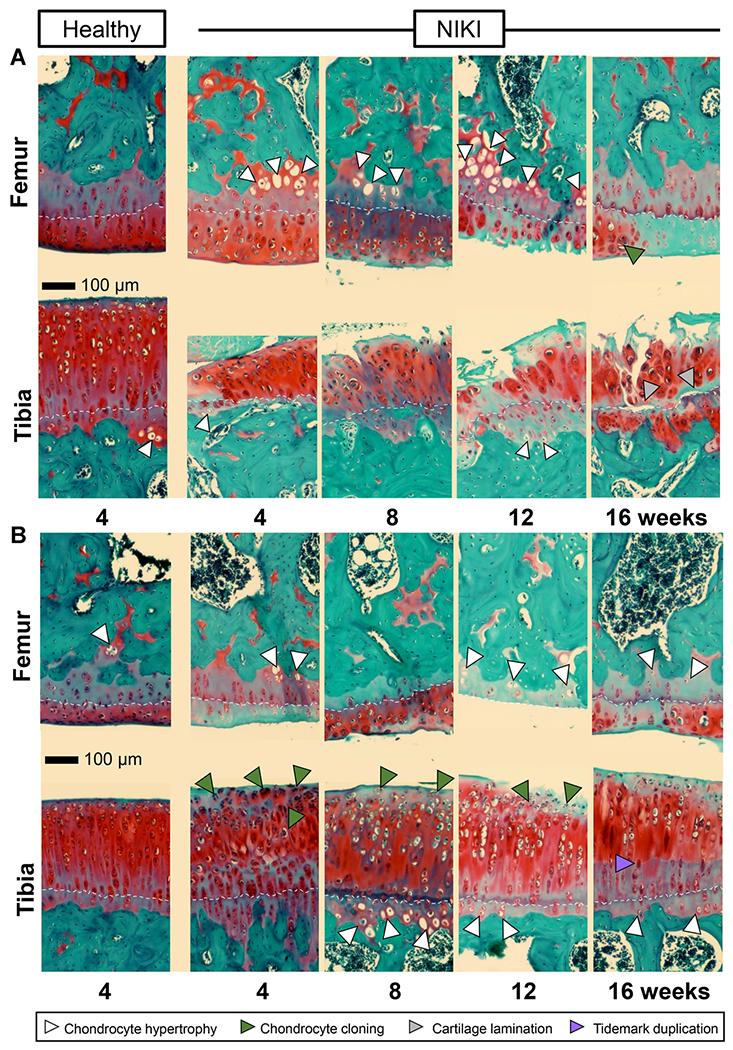
Histological appearance of articular cartilage in the (A) posterior and (B) anterior regions of the knee. Sections are stained with Safranin-O/fast green. All images were taken at the same microscope settings and at ×20. As a reference point to visualize cartilage thickness, images are aligned approximately along the cartilage tidemark (white dotted line). Scale bar = 100 μm. [Color figure can be viewed at wileyonlinelibrary.com]