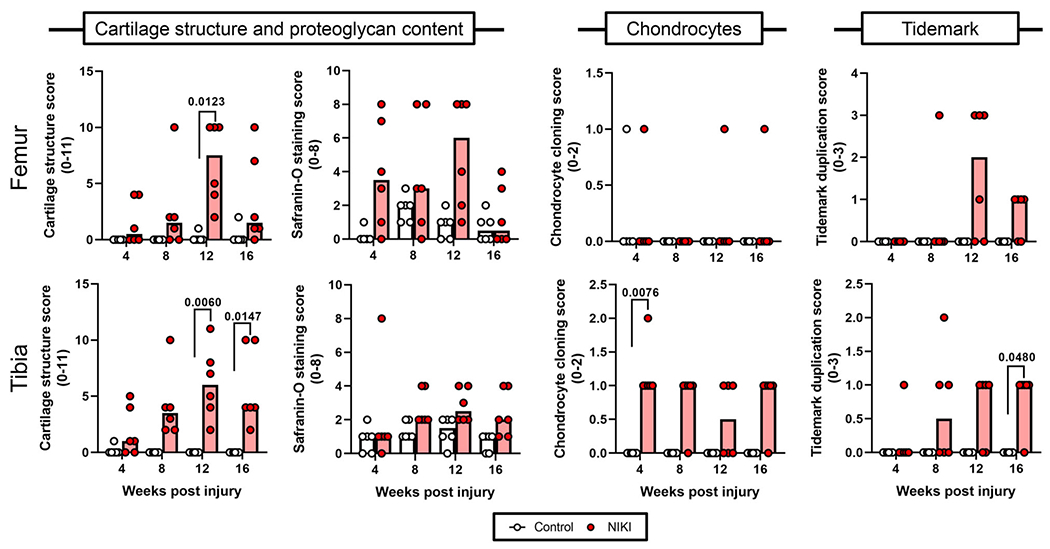
Figure 6.

Histological scoring of cartilage parameters in the medial femur and tibia over time. Each parameter was compared by a Kruskal–Wallis test followed by Dunn’s multiple comparisons tests. Graph bars = median score. [Color figure can be viewed at wileyonlinelibrary.com]
