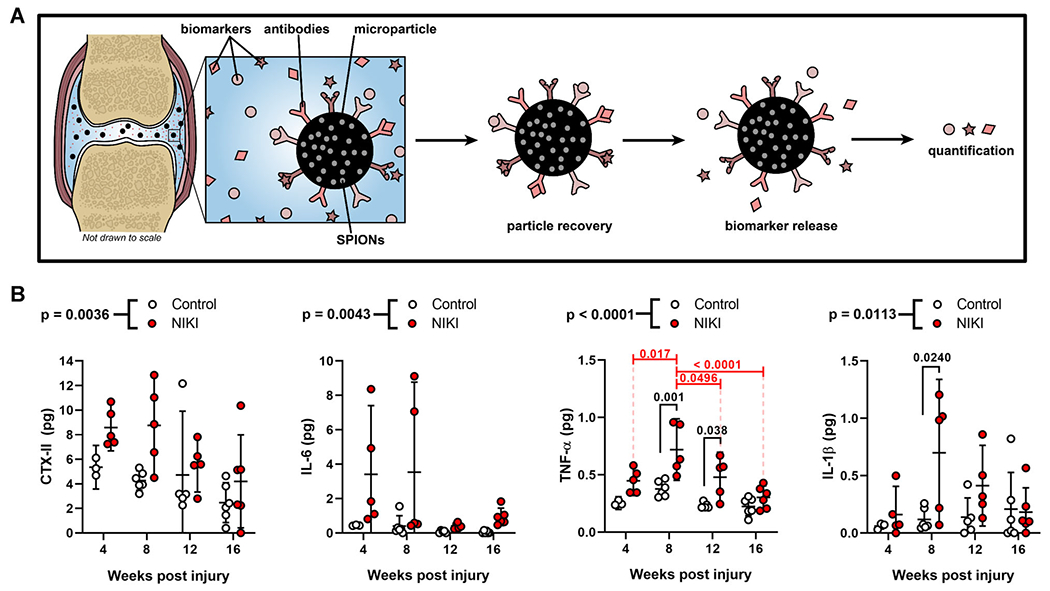
Figure 8.

Cytokine and biomarker analysis. (A) Schematic of the magnetic capture technology for quantification of synovial fluid biomarkers. (B) Quantification of CTX-II, IL-6, TNF-α, and IL-1β in the synovial fluid immediately post-mortem at each time point. p-Values above graphs = two-way analysis of variance treatment effect (NIKI vs. control); p-values within graphs = Tukey’s multiple comparisons. SPION, superparamagnetic iron oxide nanoparticle. [Color figure can be viewed at wileyonlinelibrary.com]
