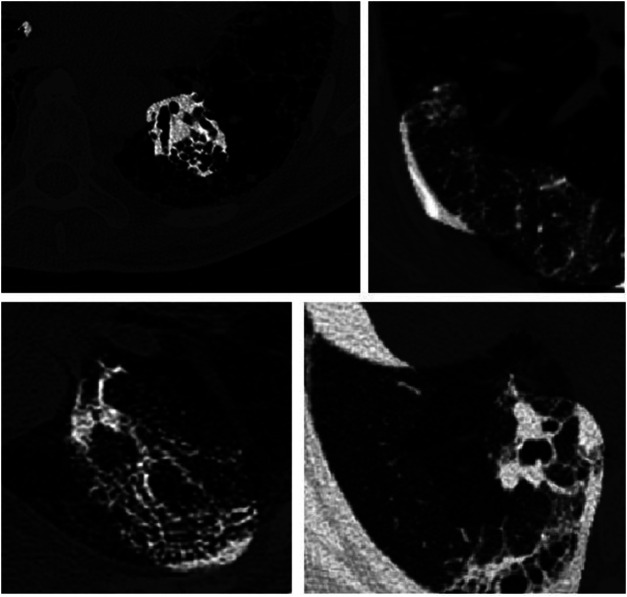
FIGURE 3.
Example critical factors (highlighted as brighter regions) in example CT images of pulmonary fibrosis patients as identified by GSInquire (Lin et al., 2019). It can be observed that Fibrosis-Net is capable of leveraging clinically relevant visual indicators such as the presence and geographic extent of honeycombing in the lungs as presented in the CT images to make FVC predictions.

