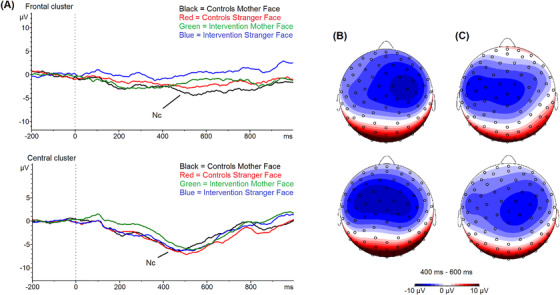
FIGURE 2.

Grand average waveforms and topographical plots of the Nc ERP component by condition and group. Grand averaged waveforms (A) are plotted by group and condition at the frontal (top) and central (bottom) electrode clusters with the Nc component indicated. Topographies of the Nc are shown for (B) control (CAU) infants and (C) intervention infants in the mother (top) and stranger (bottom) conditions
