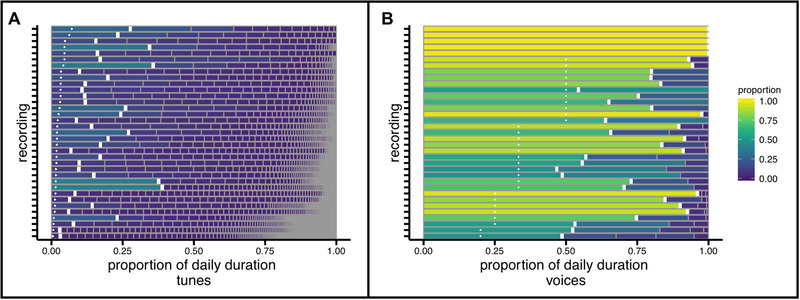
FIGURE 4.

Non‐uniformly available tune and voice identities in individual daylong recordings of everyday music in infancy. Each row is one recording, segmented into unique identities organized from most‐to‐least available (left‐to‐right). The observed proportion of each recording's most available identity (thick white vertical line) exceeded the per‐identity proportion expected from uniformly distributed identities (small white +) in daily distributions of (A) tunes and (B) voices. Recordings in each panel are sorted according to the uniform per‐identity proportion.
