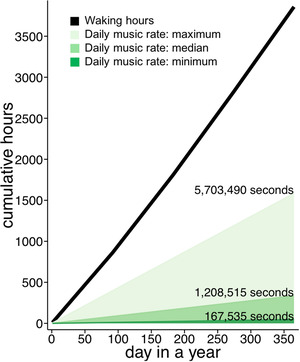
FIGURE 6.

Pre‐enculturation sensory history: an estimated year of everyday music. Lines show linear extrapolation of the minimum (459 s per day; dark green), median (3,311 s per day; green), and maximum (15,626 s per day; light green) daily musical seconds observed in the present corpus. Waking hours were estimated following Galland et al. (2012).
