Figure 5.

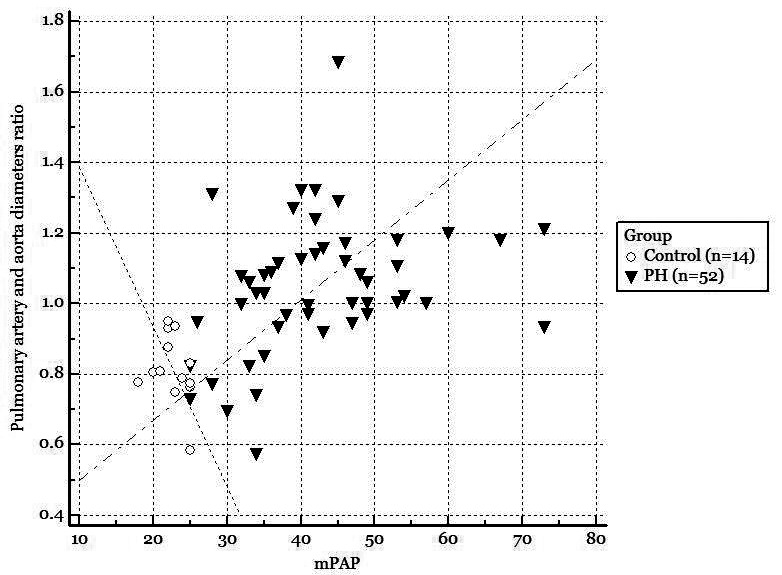
Significantly higher correlation coefficients of pulmonary artery/aorta (PA/A) and mean pulmonary artery pressure (mPAP) in the pulmonary hypertension (PH) croup compared with the control group.

Significantly higher correlation coefficients of pulmonary artery/aorta (PA/A) and mean pulmonary artery pressure (mPAP) in the pulmonary hypertension (PH) croup compared with the control group.