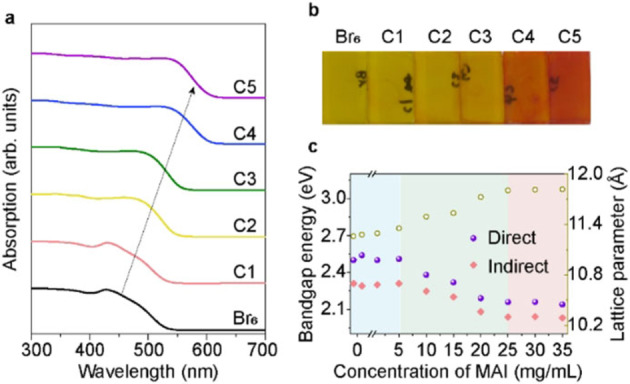
Figure 3.

(a) UV/Vis absorption spectra and (b) optical images of six samples treated with different concentrations of MAI, increasing from left to right (Br6 to C5). (c) Change of bandgap energy (direct and indirect bandgap) and lattice parameter of obtained films as function of MAI concentrations in the preparation of the film. The lattice parameters were calculated from the (400) reflection by Gauss fitting to obtain peak position (in Figure S7).
