. 2021 Jul 21;26(10):1240–1247. doi: 10.1111/tmi.13646
© 2021 The Authors Tropical Medicine & International Health Published by John Wiley & Sons Ltd
This is an open access article under the terms of the http://creativecommons.org/licenses/by-nc/4.0/ License, which permits use, distribution and reproduction in any medium, provided the original work is properly cited and is not used for commercial purposes.
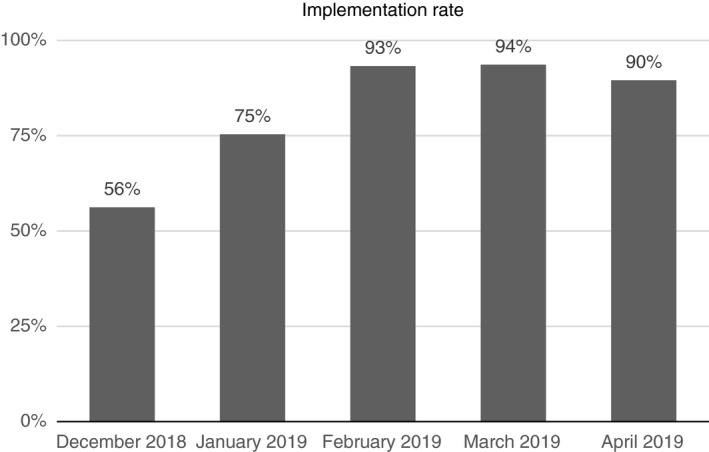
FIGURE 1.

Implementation rate per month.
