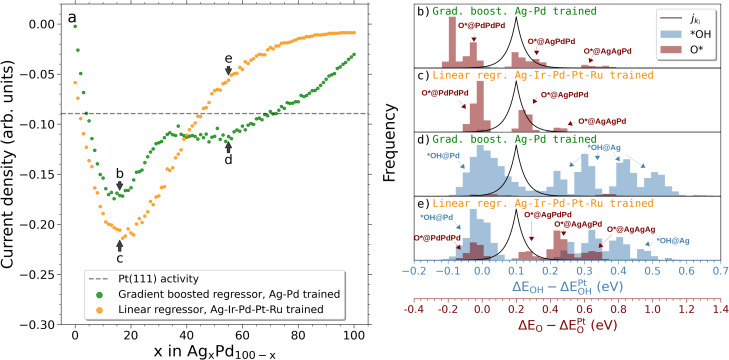
Figure 3.
a) Simulated current densities of the Ag–Pd system in a composition range from pure Pd to pure Ag with 1 at. % increments. A linear regression model trained on DFT‐calculated samples of the Ag‐Ir‐Pd‐Pt‐Ru alloy is used alongside a gradient‐boosted model trained on DFT‐calculated samples of Ag–Pd to predict the adsorption energies of the simulated surface. These predictions serve as input for Equations (1)–(3) which yield the resulting current densities. b–e) *OH and O* net adsorption energy distributions (after intersite blocking) for selected compositions corresponding to the annotations in (a). A scaled visualization of the modeled current density in Equation (3) is shown (black solid line).

