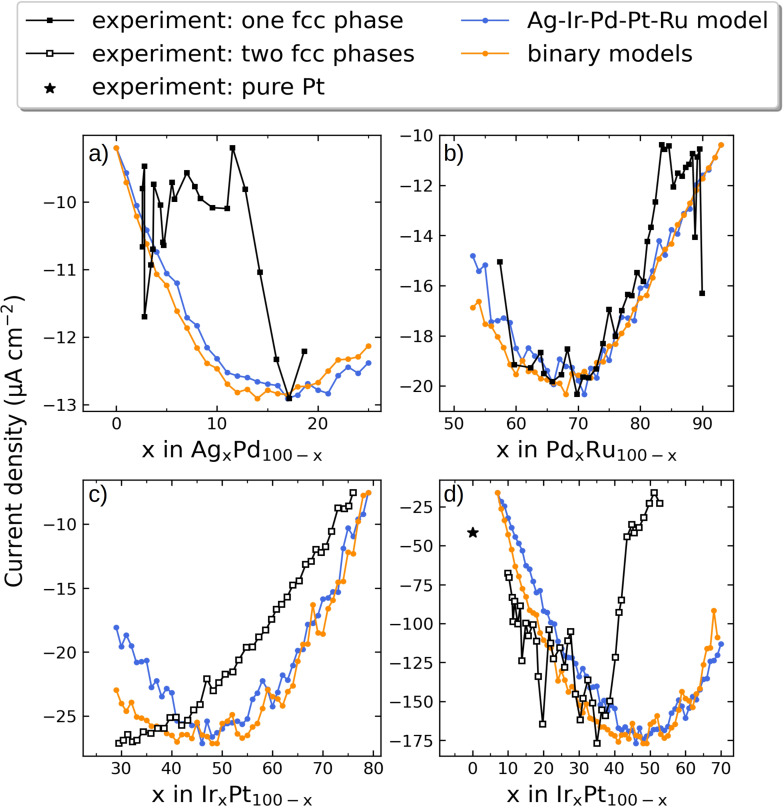
Figure 4.
Comparison of simulated and experimental catalytic activities (black curves) for a) Ag–Pd, b) Pd–Ru, and c,d) Ir–Pt (for different composition ranges in (c) and (d)) at 800 mV vs. RHE. The simulated current densities were normalized to the experimental current densities by ensuring that the minimum and maximum current densities match up. For Pd–Ru in (b) three outliers that gave rise to very high current densities were left out (see Figure S9b).

