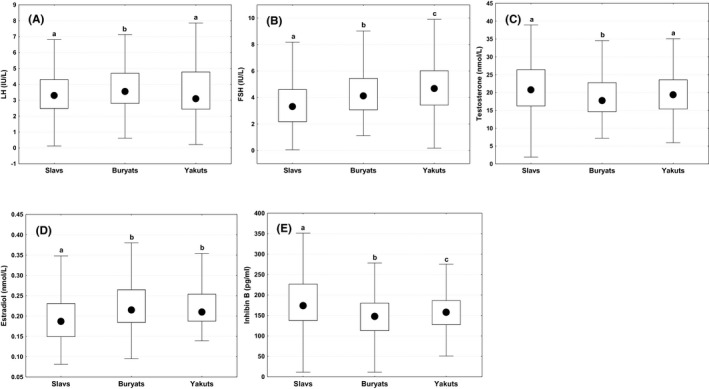
FIGURE 3.

Differences in hormonal parameters between men of three ethnic groups in (A) LH, luteinizing hormone; (B) FSH, follicle‐stimulating hormone; (C) testosterone; (D) estradiol; (E) inhibin B. Boxes indicate interquartile range; circles—median, whiskers—non‐outlier range. a, b, c, d comparisons with different superscripts are significant (p < 0.05)
