Figure 4.
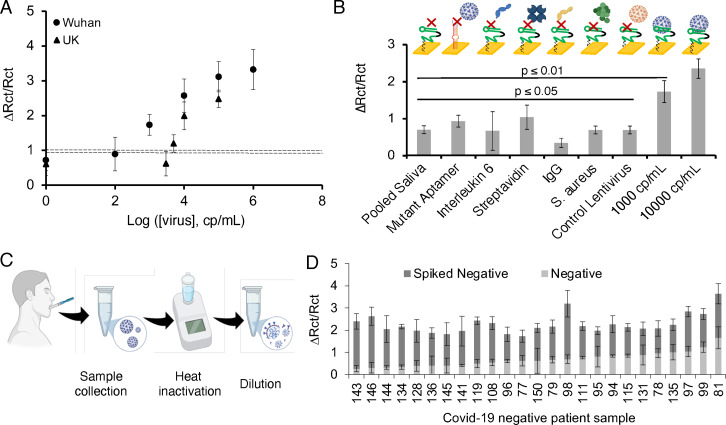
A) Calibration plot of the different concentrations of the WH and UK pseudotyped virus spiked in diluted pooled saliva. Dotted line indicates the signal change for the diluted pooled saliva without viral load. B) Control experiments done with diluted pooled saliva, mutant aptamer functionalized chip incubated with 103 cp mL−1 pseudotyped virus spiked diluted pooled saliva, Interleukin‐6–1000 pg mL−1 spiked diluted pooled saliva, Streptavidin‐1000 pg mL−1 spiked diluted pooled saliva, S. aureus‐105 CFU mL−1 spiked diluted pooled saliva, control lentivirus‐105 cp mL−1 spiked diluted pooled saliva, pseudotyped virus (103–104 cp mL−1) spiked diluted pooled saliva. C) Method for collection of patient saliva, patient sample treatment was done by heating the collected sample at 65 °C for 30 min followed by diluting in binding buffer (1:1 v/v %). D) Charge transfer resistance for 25 COVID‐19 negative saliva samples before and after spiking with 104 cp mL−1 Wuhan pseudotyped virus. The error bars represent the standard deviation from the mean obtained using three (n=3) separate devices per sample.

