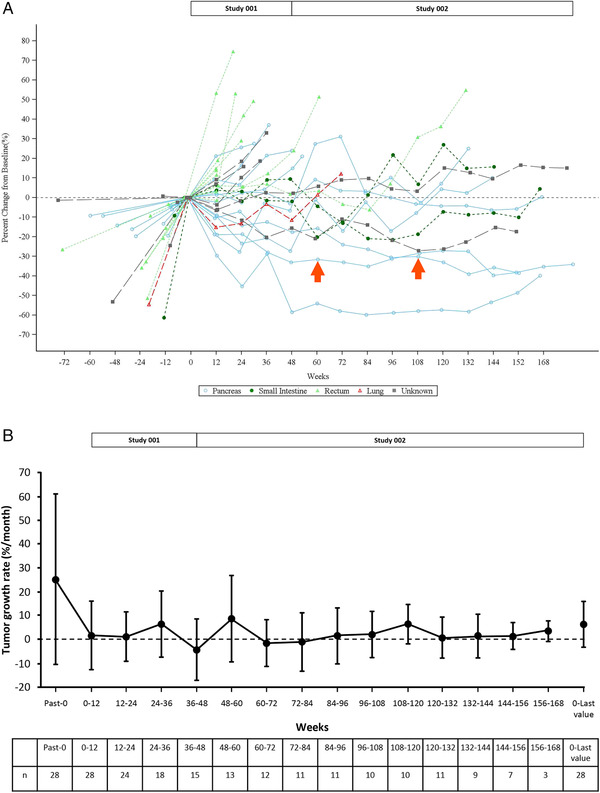
FIGURE 3.

Changes in tumor size during lanreotide treatment in the efficacy analysis set (n = 28). Data, based on RECIST (ver. 1.1), were evaluated by each investigator before treatment and via central assessment by an independent third party at every subsequent evaluation. Spider plot of the percent change in the sum of tumor diameters of each target lesion from the baseline measurement (A). Arrows indicate partial responses achieved in two patients (one was at 60 weeks and the other was at 108 weeks). Tumor growth rate as a percent change (± standard deviation) in tumor volume per month (B). The calculation of the tumor growth rate is described in the “Supplementary Method” [Colour figure can be viewed at wileyonlinelibrary.com]
