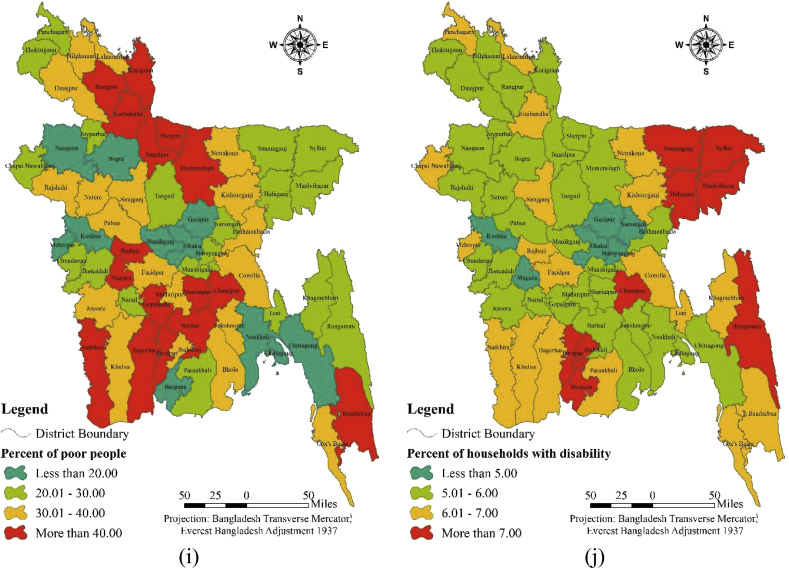
Figure 2.
Spatial priority of the factors: (a) confirmed COVID-19 cases (per 100000 population), (b) percent of total population, (c) population density (persons per square kilometers), (d) percent of population over the age of 40, (e) percent of urban population, (f) percent of working-age people, (g) percent of industrial workers, (h) percent of the service sector employment, (i) percent of poor people, (j) percent of households with disability.


