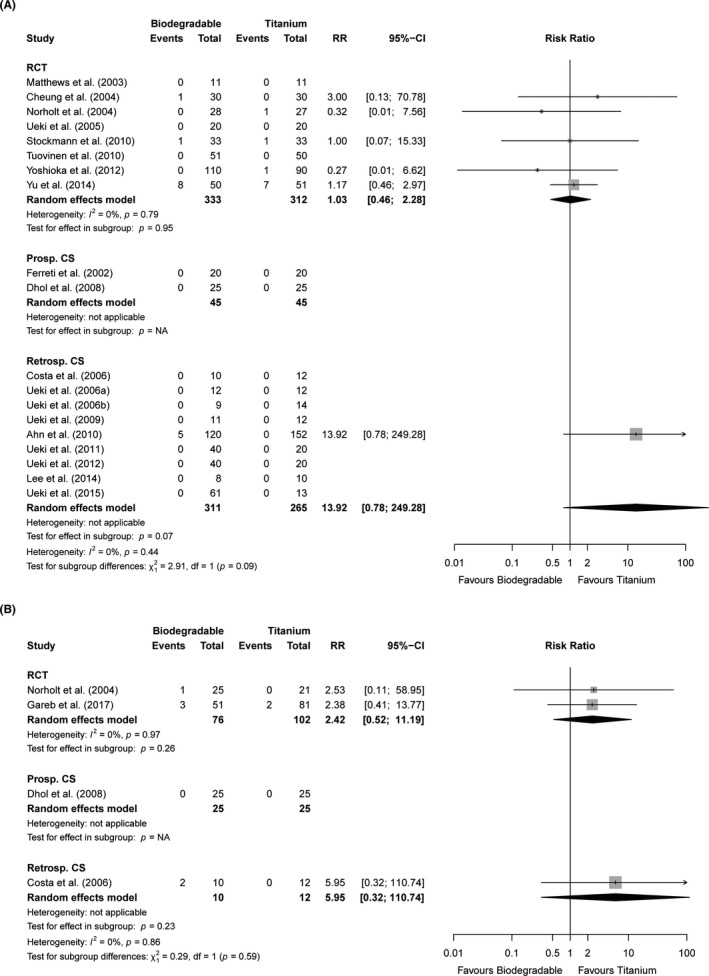
FIGURE 3.

Forest plots of the endpoints (A) infection (<4 weeks follow‐up) and (B) swelling (>12 weeks follow‐up) stratified by study design. 95%‐CI, 95% confidence interval; Prosp. CS, prospective cohort studies; RCT, randomised controlled trials; Retrosp. CS, retrospective cohort studies; RR, risk ratio
