
Fig 4.
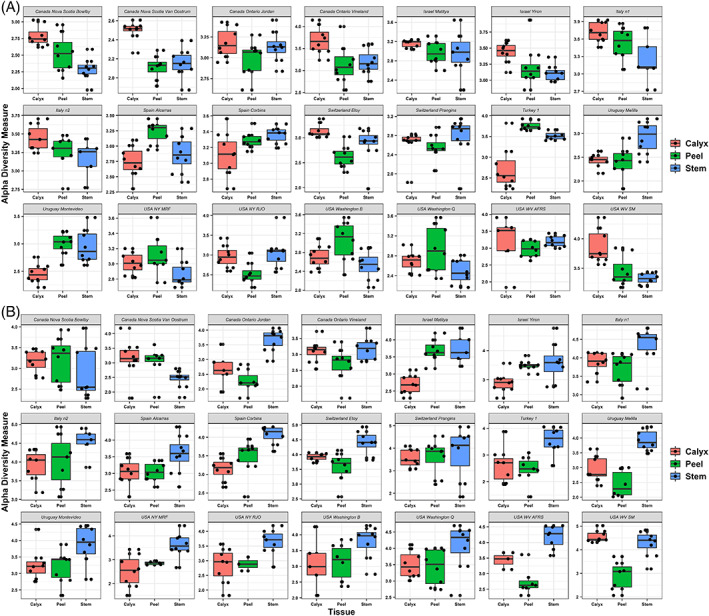
Boxplots of fungal (top) and bacterial (bottom) Shannon diversity among apple tissues (Calyx, stem and peel) collected from 21 orchards located in eight countries. The figure is arranged in seven columns and three rows for fungi (A) and bacteria (B). Each subpanel corresponds to an orchard. From left to right, the first row shows the results of Nova Scotia Bowlby (Canada), Nova Scotia Van Oostrum (Canada), Ontario Jordan (Canada), Ontario Vineland (Canada), Matitya (Israel), Yiron (Israel) and orchard n1 (Italy). The second row shows the results from orchard n2 (Italy), Corbins (Spain), Alcarràs (Spain), Prangins (Switzerland), Etoy (Switzerland), orchard 1 (Turkey), Melilla (Uruguay). The third row shows the results from Montevideo (Uruguay), MRF (NY, USA), RJO (NY, USA), orchard B (Washington USA), orchard Q (Washington USA), AFRS (WV USA), SM (WV USA). A and B are arranged in the same order.