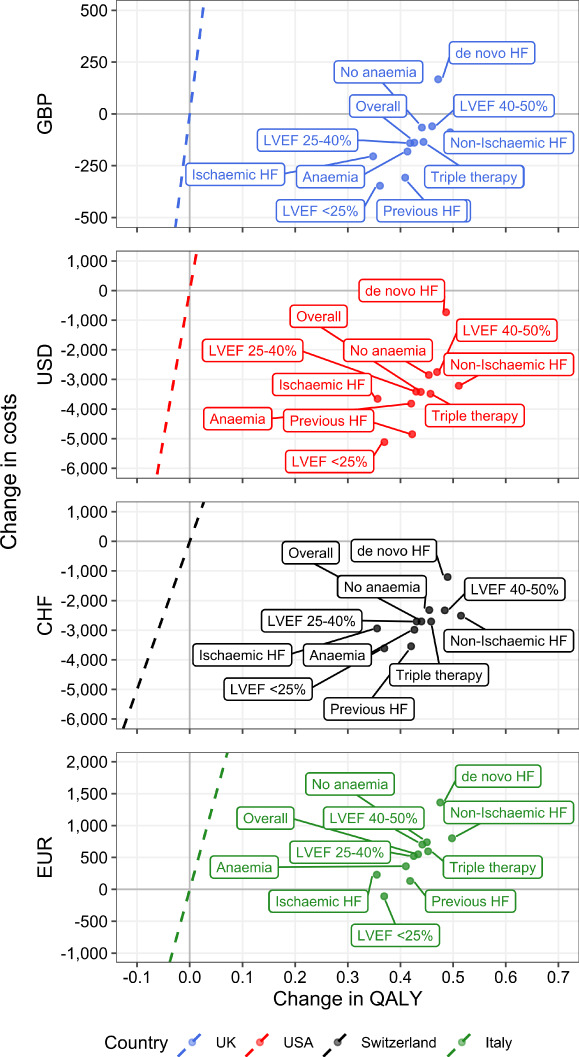
Figure 2.

Subgroup analysis. Points are shown on the cost‐effectiveness plane for the mean value analysis of indicated patient subgroups. Dashed lines correspond to the willingness‐to‐pay threshold for each country. Points to the right of the dashed line would be considered cost‐effective at the given willingness‐to‐pay threshold, while points to the right of the y‐axis [positive change in quality‐adjusted life‐year (QALY)] and below the x‐axis (decreased costs) are considered dominant. CHF, Swiss Francs; EUR, Euros; GBP, Great Britain Pounds Sterling; HF, heart failure; LVEF, left ventricular ejection fraction; USD, United States Dollars.
