
FIGURE 2.
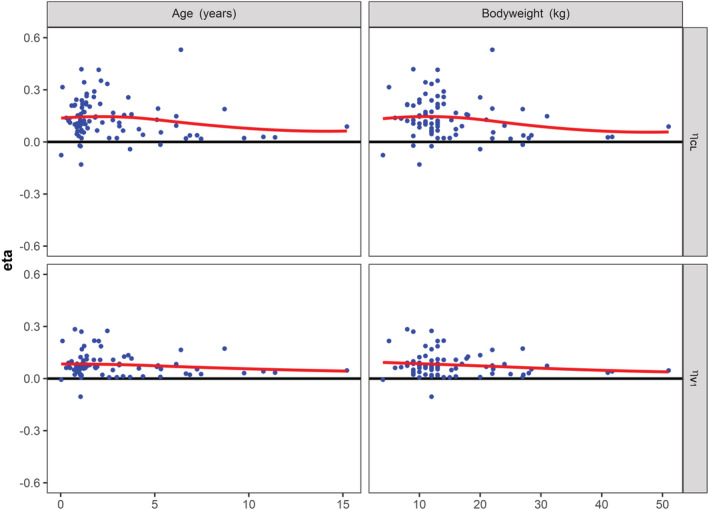
Eta of clearance and volume of distribution vs age and body weight for the new cohort. Post hoc values for eta of clearance (CL) and volume of distribution of the central compartment (V1) were obtained using the original population PK model and were plotted against age and body weight of the patients from the new cohort. Clearly, all the figures demonstrate a systematic bias from zero, as depicted by the locally estimated scatterplot smoothing (LOESS) line in red