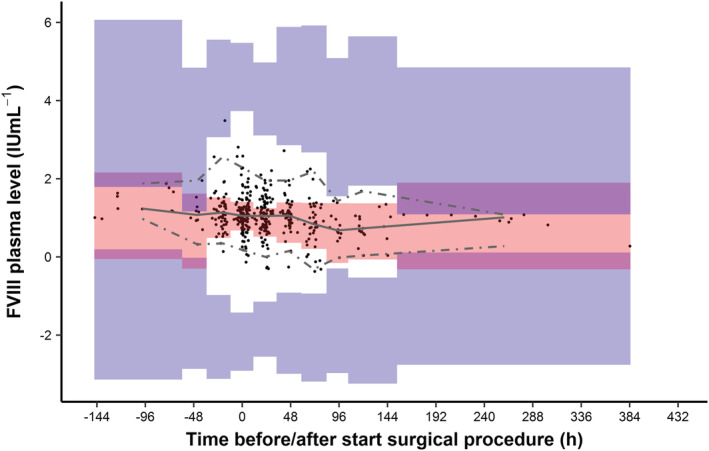
FIGURE 3.

Prediction‐corrected visual predictive check of the original model for the new cohort. Time is defined as the time of start of the surgical procedure. Data with negative times represent samples taken before the start of the surgical procedure. Black dots represent the measured FVIII levels for all patients. Solid grey line represents the median and the dashed grey lines represent the 2.5th and 97.5th quantiles of the measured FVIII levels. Red and blue‐shaded areas show the 95% confidence intervals for the predicted individual FVIII levels, as obtained by 2000 Monte Carlo simulations using the original model. The binning of the areas for the prediction intervals were created using the auto‐bin option in Perl‐Speaks‐NONMEM. In total, approximately 5.7% of the measured FVIII levels were outside the 2.5th and 97.5th quantiles of the measured FVIII levels
