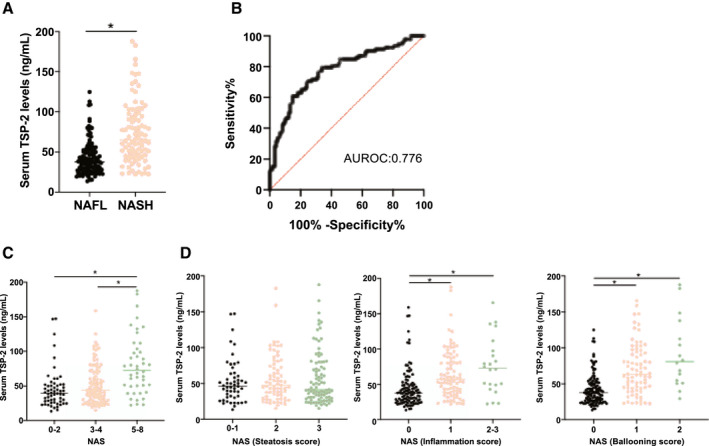
FIG. 4.

Serum TSP‐2 levels discriminated NASH from NAFL among patients with NAFLD patients. (A) Relative serum TSP‐2 levels in 121 patients with NAFL and 92 patients with NASH (*P < 0.01). (B) Receiver operating characteristic curve of the performance of serum TSP‐2 levels in the diagnosis of NASH among 213 patients with biopsy‐proven NAFLD. The AUROC is shown. (C) Relative serum TSP‐2 levels based on the NAS (*P < 0.01). (D) Relative serum TSP‐2 levels based on the steatosis (left), inflammation (middle), and ballooning (right) scores of the NAS (*P < 0.01).
