FIG. 5.

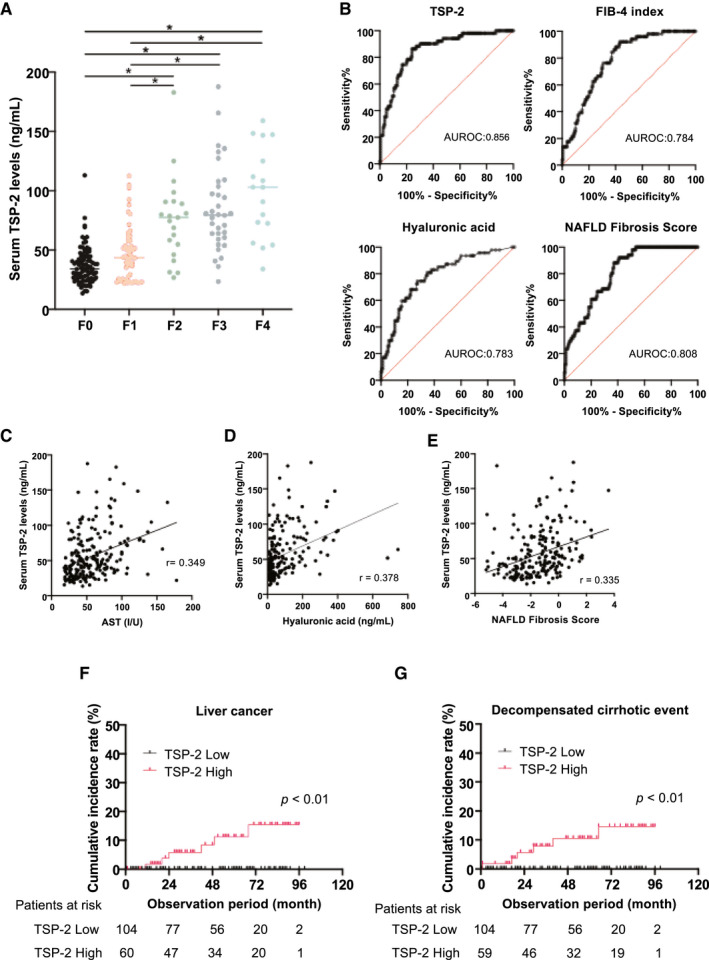
Serum TSP‐2 levels identified advanced fibrosis patients among patients with NAFLD. (A) Relative serum TSP‐2 levels based on fibrosis staging in 213 patients with biopsy‐proven NAFLD (*P < 0.01). (B) Receiver operating characteristic curve of the performance of serum TSP‐2 levels, FIB‐4 index, HA, and NFS in the diagnosis of advanced liver fibrosis (F3‐F4) among patients with NAFLD. The AUROC is shown. (C‐E) Correlation of serum TSP‐2 levels with serum AST levels (C), serum HA levels (D), and NFS (E). (F,G) Kaplan‐Meier curves of the cumulative incidence rate of liver cancer (F) in 164 patients with NAFLD and decompensated cirrhotic events, including esophageal varices, ascites, and hepatic encephalopathy (G) in 163 patients with NAFLD stratified by serum TSP‐2 levels. Number of patients at risk is shown at each observation period.
