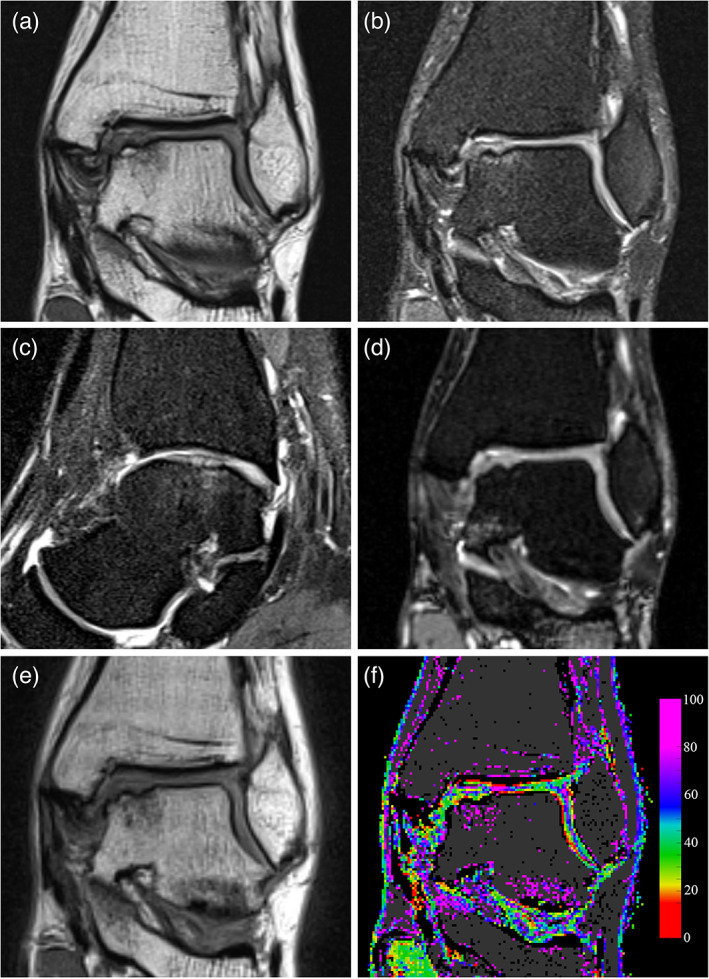
FIGURE 1.

Mid‐term follow‐up MRI images of the talar bone region showing an OCLT. (a) Coronal proton density turbo spin‐echo (PD‐TSE). (b) Coronal fat suppressed PD‐TSE. (c) Sagittal fat suppressed PD‐TSE. (d) Coronal T2‐weighted true fast imaging with steady‐state‐free precession (T2‐TRUFI). (e) Coronal T2 multi‐echo sequence, first echo at TE = 13.8 msec. (f) Coronal T2 map obtained by processing the multi‐echo sequence, T2 values are represented according to the color map on the left. Voxels where curve fitting was unreliable or presenting low signal are shown in black, while possible bone tissue is shown in dark grey. The image was produced without interpolating color between voxels.
