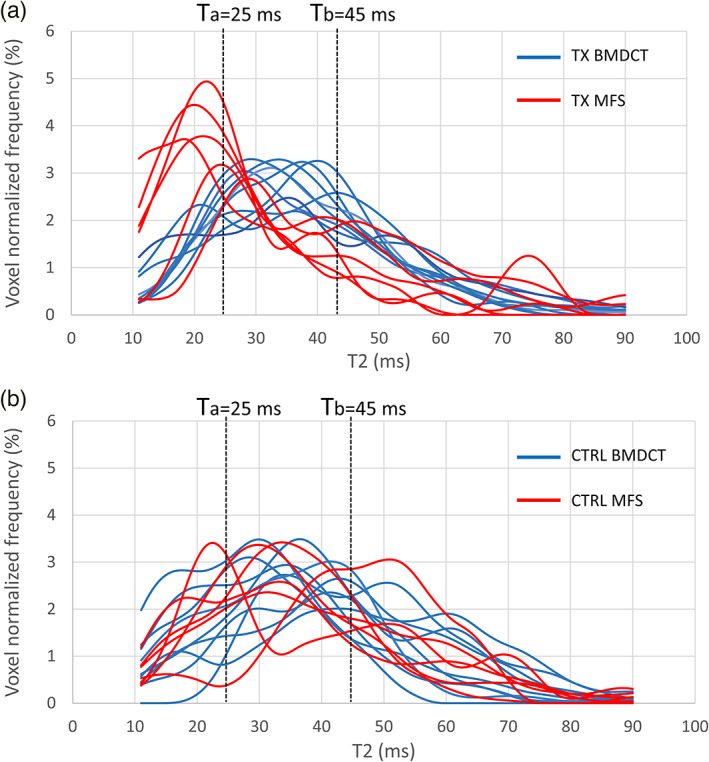
FIGURE 4.

Normalized frequency histograms of T2 values of each volume of interest (VOI) in the whole study population. (a) Treated (TX) VOIs. (b) Control (CTRL) VOIs. Data in each panel are color‐coded according to the treatment type (MFX in red, BMDCT in blue). Dashed lines indicate T2 values of Ta = 25 msec and Tb = 45 msec considered as boundaries for differentiating between fibro‐cartilage (T < 25 msec), hyaline‐like tissue (25 msec < T2 < 45 msec), and tissue under remodeling (T > 45 msec).
