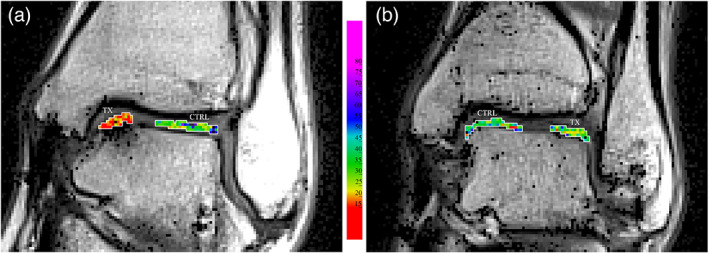
FIGURE 5.

T2 values inside the treatment (TX) and control (CTRL) VOIs, delineated in white, superimposed on the image of first echo signal. (a) Patient treated with MFS. (b) Patient treated with BMDCT. Images were produced without interpolating color between voxels.
