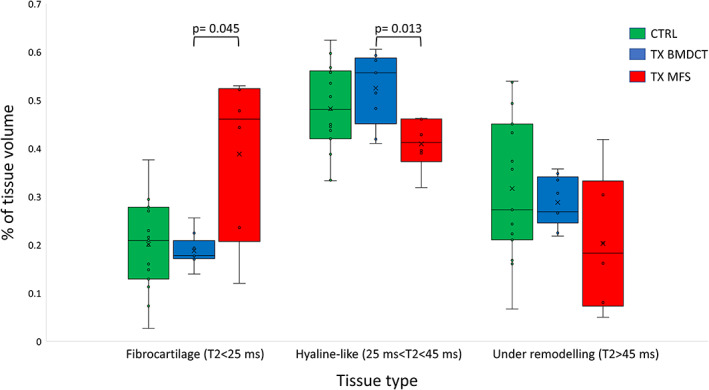
FIGURE 6.

Box plot summarizing the percentage of the three different tissue types evaluated by T2 mapping in different volumes of interests: controls (N = 15) (CTRL), lesions treated according to regenerative surgery (N = 9) (TX BMDCT), and lesions treated according to reparative surgery (N = 6) (TX MFS).
