
FIGURE 4.
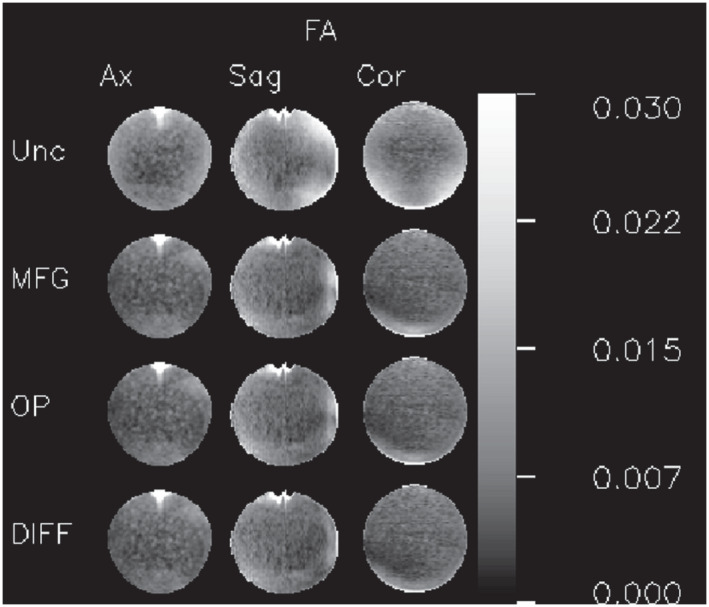
Fractional anisotropy (FA) orthogonal slices. Matrix of FA maps. Each column contains a different plane: midline axial (Ax), midline sagittal (Sag), and midline coronal (Cor). Each row contains images computed using different GCFMs for the gradient nonuniformity correction: uncorrected (Unc), corrected using the manufacturer supplied GCFM (MFG), corrected using a GCFM computed from phase contrast images of an oil phantom (OP), and corrected using the method presented in this paper (DIFF). The uncorrected maps contain larger values and a clearly organized spatial pattern. The 3 GCFMs used for the corrections yield similar results. The regions with large errors at the top of the axial and sagittal images are caused by large local susceptibility‐induced field gradients due to the meniscus of the air bubble