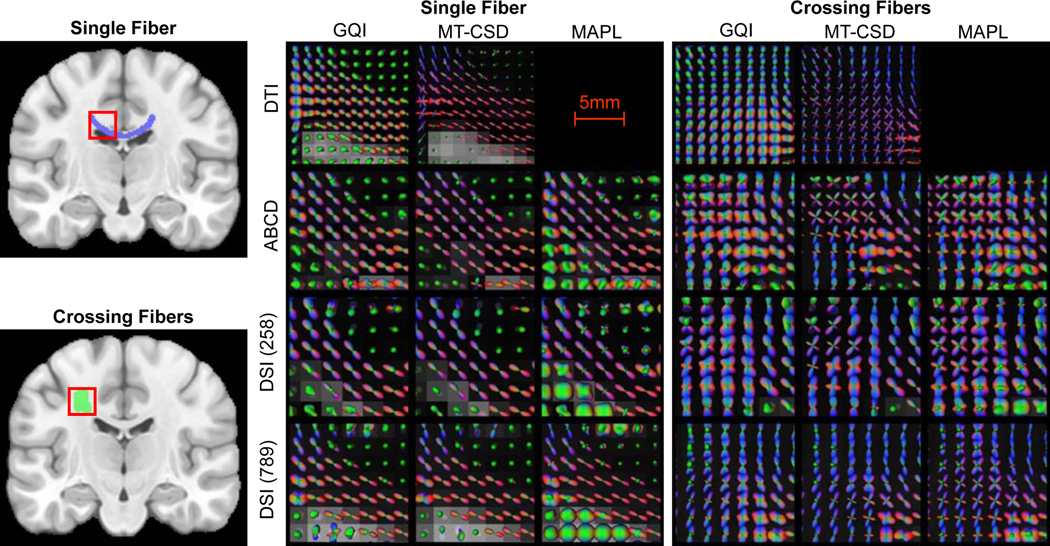
Extended Data Fig. 3. QSIPrep reconstruction workflows produce comparable output across diverse sampling schemes and reconstruction methods.
Four sampling schemes each reconstructed using four methods: GQI from DSI Studio, multi-tissue CSD from MRtrix, and MAPL from Dipy. ODF fields are shown in two white matter regions (left), a single fiber area in the corpus callosum (top) and a crossing fiber region in the centrum semiovale (bottom). The middle panel shows ODFs reconstructed in the single fiber region, and the right panel shows ODFs reconstructed in the crossing fiber region for the four sampling schemes (rows) and the three reconstruction methods (columns).

