
FIGURE 1.
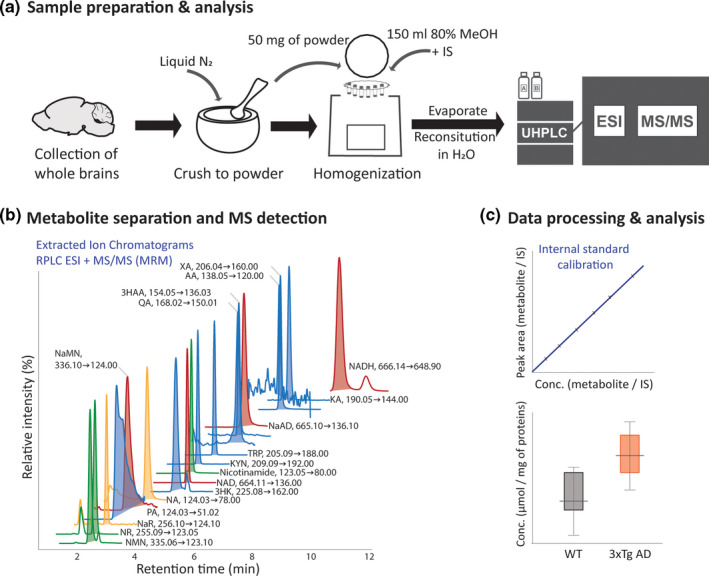
NAD+metabolite analysis pipeline, from (a) sample preparation to (b) LC‐MS/MS analysis, including metabolite separation and targeted mass spectrometry‐assisted quantification and (c) data processing and analysis. For metabolite extraction, brain tissue was homogenized with the addition of internal standards (IS spike) in methanol:water (4:1, v/v) using tissue homogenizer with cold trap (Precellys Cryolys). The NAD+metabolites present in the pre‐concentrated tissue extract were injected into the LC‐MS/MS system for separation (using reversed phase column with weak ionic ligands ‐ Scherzo SM‐C18, Imtakt, USA) and MS/MS detection in multiple reaction monitoring (MRM) mode using specific precursor ➜product ion transitions. Presented ion chromatograms were extracted from the standard mixture analysis. Concentration was determined based on the IS response and the calibration curve. Statistical analysis was performed following the data quality assessment. NAD+ de novo synthesis – blue peaks: TRP tryptophan, KYN kynurenine, KA kynurenic acid, 3HK 3‐hydroxy‐kynurenine, AA anthranilic acid, 3HAA 3‐hydroxyanthranilic acid, XA xanthurenic acid, PA picolinic acid, QA quinolinic acid; ‘NAD+ backbone’ – red peaks: NaMN nicotinic acid mononucleotide, NaAD nicotinic acid adenine dinucleotide, NAD+ nicotinamide adenine dinucleotide and NADH nicotinamide adenine dinucleotide +hydrogen; Preiss‐Handler pathway – yellow peaks: NaR nicotinic acid riboside, NA nicotinic acid; Salvage pathway – green peaks: NR nicotinamide riboside, nicotinamide, NMN nicotinamide mononucleotide