
FIGURE 3.
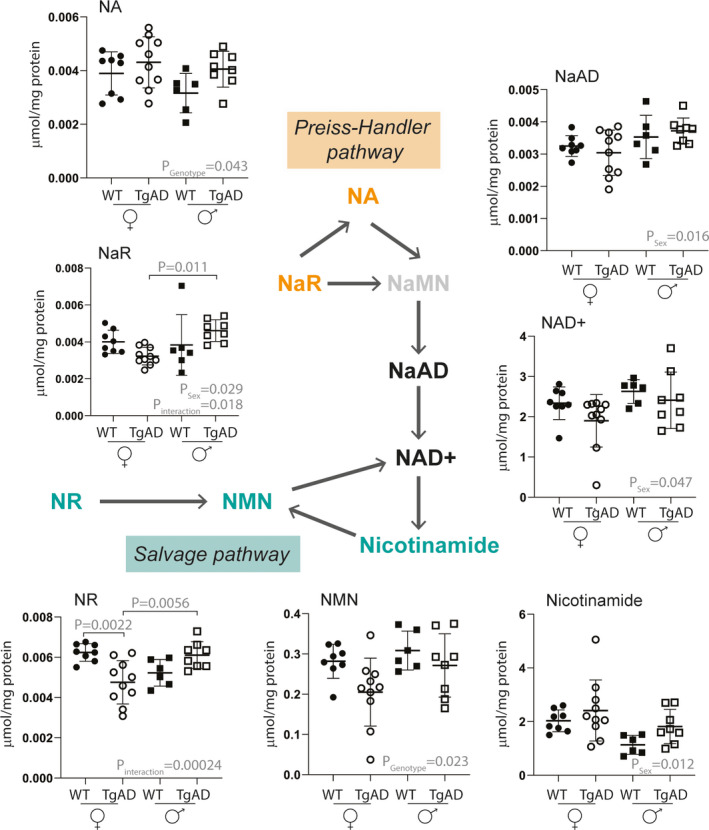
Levels of NAD+metabolites in the Preiss‐Handler and salvage pathway measured in brains of 8‐month‐old WT and 3xTg AD mice. All metabolites were quantified using RP chromatography with weak ionic exchange (Scherzo SM‐C18, Table 1). Metabolite in gray was below the level of detection in AD and/or WT brain tissue. NA nicotinic acid, NaR nicotinic acid riboside, NaMN nicotinic acid mononucleotide, NaAD, nicotinic acid adenine dinucleotide, NAD+nicotinamide adenine dinucleotide, NR nicotinamide riboside, NMN nicotinamide mononucleotide. The P‐values PSex, Pgenotype, and Pinteraction result from ANOVA analysis using the following model: metabolite concentration =Sex *Genotype; p‐values above graphs result from subsequent post‐hoc analysis. Metabolite concentrations were reported to total protein content which was correlated with tissue weight and was not different between genotypes (Table S3).