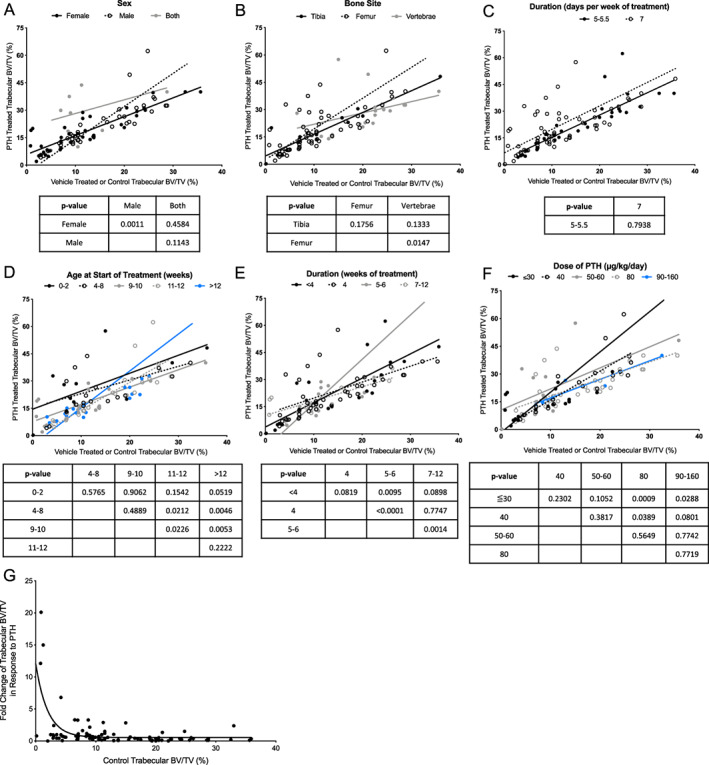
FIGURE 2.

Trabecular bone response in WT mice. (A–F) Trabecular bone volume is graphed for vehicle‐treated (x axis) and PTH‐treated (y axis) WT mice. Each plot stratifies a different variable, including (A) sex, (B) bone site analyzed, (C) duration (days per week of treatment), (D) age at the start of treatment, (E) duration (weeks of treatment), or (F) dose of treatment. Linear regression of the slope was analyzed for each group and compared within a variable. The p values are reported in the charts under each graph, and correspond to the analysis between the column and row headers (i.e., in (A), the slope of the line for male and female has a p‐value of 0.0011). (G) Control trabecular bone volume in WT mice and the FC of trabecular bone volume in response to PTH in WT mice is plotted. The AIC is a statistical predictor of error between two models, and was used to confirm an inverse exponential relationship between control bone volume and the FC in bone volume with PTH in WT mice. Abbreviations: AIC, Akaike Information Criterion; PTH, parathyroid hormone; WT, wild‐type; FC, fold change.
