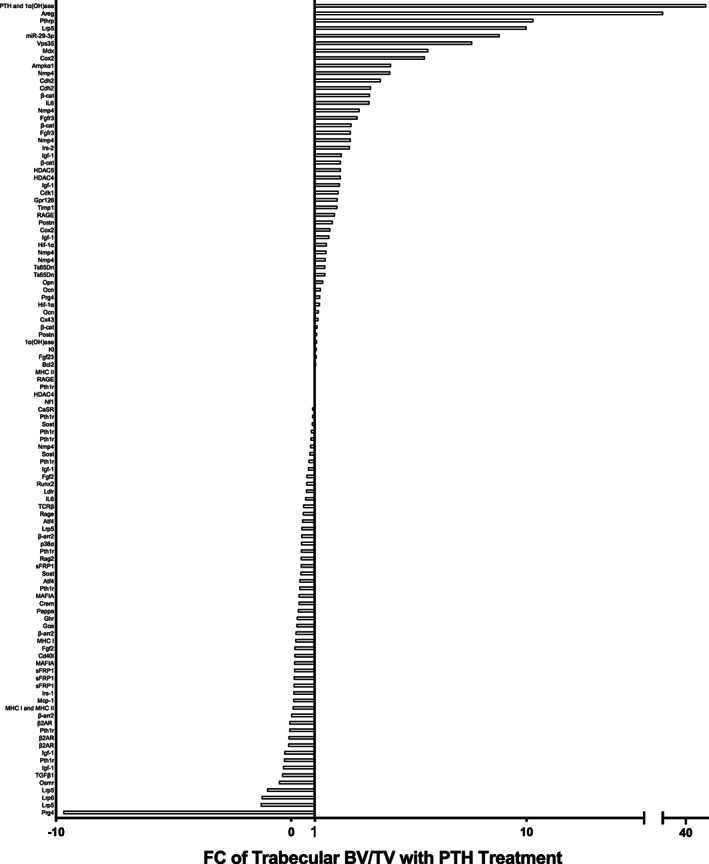
FIGURE 3.

FC of PTH‐/control‐treated trabecular bone volume per total volume per targeted gene model. The response to PTH treatment in gene targeted murine models was calculated using the bone volume FC in mutant mice relative to the FC of control treated mice. The x axis lists the targeted gene. Some genes are listed multiple times, each of which represents a different study or cohort of animals listed in Table 2. If there was no change between control and genetically modified treated animals, the FC is 1, indicated by the marked line. Abbreviations: FC, fold change; PTH, parathyroid hormone.
