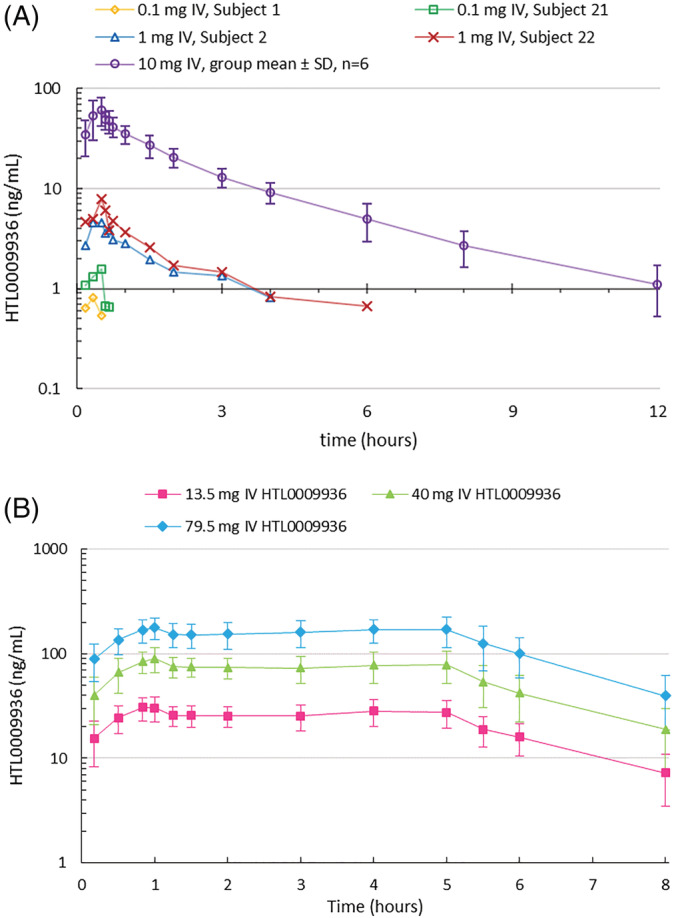
FIGURE 2.

A. Concentration–time profiles of HTL0009936 single IV infusion at 0.1 mg (n = 2), 1 mg (n = 2) and 10 mg in part A (mean ± SD for n = 6). B. Concentration–time profiles at 13.5, 40 and 79.5 mg HTL0009936 by dual IV infusion in part B (arithmetic mean ± SD; n = 28–29). Profile truncated at 8 hours to show plateau during maintenance dose
