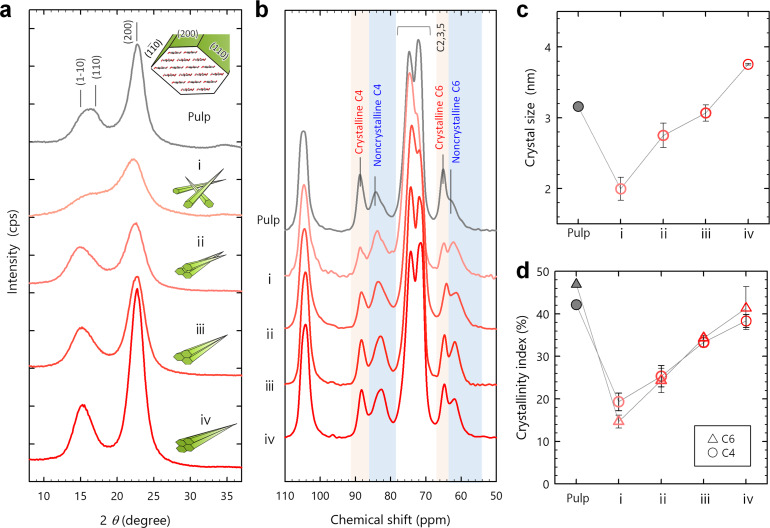
Figure 1.
Recovery of crystallinity. a) XRD profiles and b) CP/MAS 13C NMR spectra of a series of samples ranging from the starting pulp to CNF samples i–iv. c) Crystal size of the (2 0 0) plane calculated from the XRD profiles, and d) crystallinity indices of the C4 and C6 carbon atoms calculated from the NMR spectra. Each plot shows the mean values with standard deviations estimated using three sets of samples i–iv.

