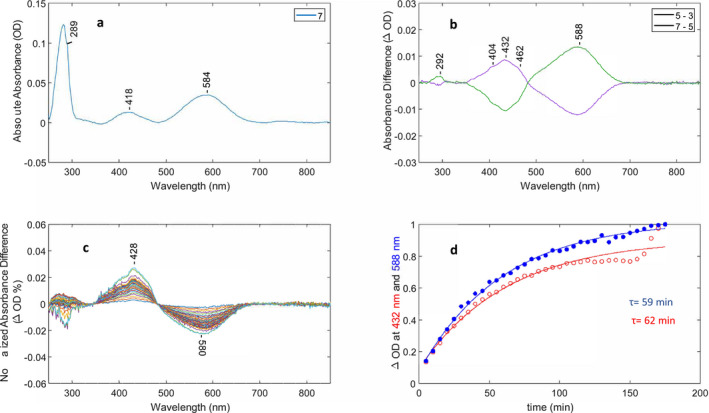
Figure 3.

Optical switching of NovArch using 660 and 405 nm light and O decay kinetics. (A) Baseline‐corrected absorption of NovArch from spectrum #7 in cycling sequence (see Figure S2). (B) Two baseline‐corrected difference spectra (#5–#3, #7–#5) from cycling sequence. (C) Baseline‐corrected difference spectra recorded after last red‐light illumination in sequence. Each difference spectrum consists of dark spectrum (N = #13–36) minus spectrum #12. Differences were also normalized to the 280 nm absorption band for each dark spectrum to correct for sample settling in cuvette. (D) Time course of the difference peak amplitudes in C at 588 and 432 nm reflecting decay and formation of the O‐like and M‐like states, respectively, as function of time. Changes in the absolute absorbance differences were normalized between 0 and 1 and the decay at 588 nm (blue trace) inverted. Time constants were calculated using a single‐exponential function (see Materials and Methods).
