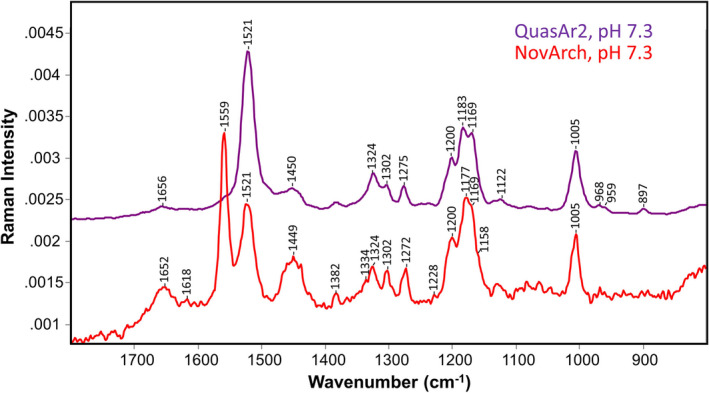
Figure 6.

FT‐Raman spectra of QuasAr2 (purple) and NovArch (red) reconstituted in membrane vesicles and recorded at pH 7.3. Spectra were scaled using the band near 1005 cm−1. Y‐axis scale shown is for NovArch. Laser power was 300 mW for both samples, and data acquisition times were 3.5 h for QuasAr2 and 5.6 h for NovArch (see Materials and Methods for additional details). Data for QuasAr2 are reproduced from ref (24).
