
FIGURE 2.
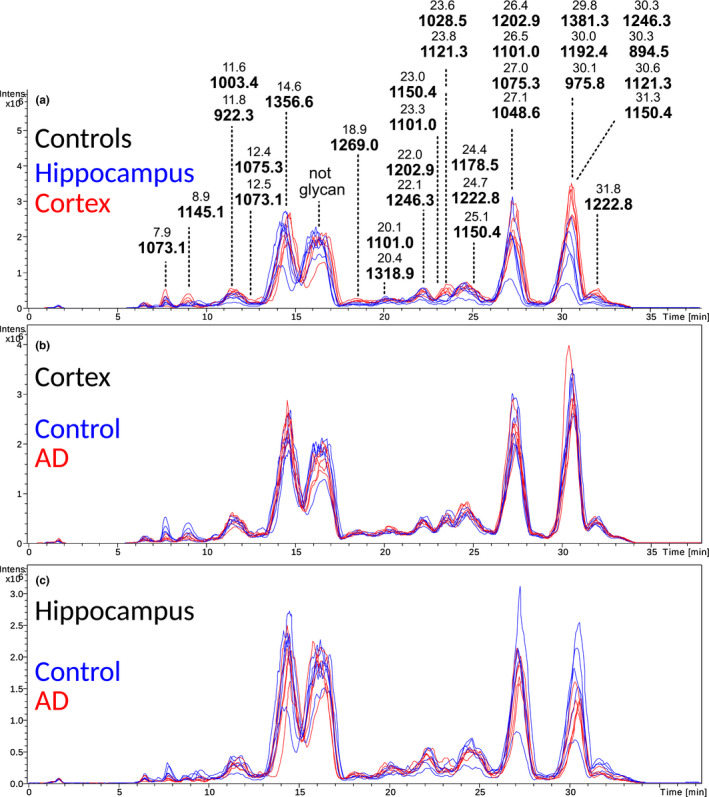
Basepeak chromatograms of the N‐glycome of frontal cortex and hippocampus from control and AD brain. (a) Overlayed control cortex (red) and control hippocampus (blue) basepeak chromatograms of released and 2‐AA‐labeled N‐glycans separated on C18 prior to MS detection. The chromatogram has been annotated with m/z and retention time for the 31 structures reported in this study. (b and c) Overlay of ten base peak chromatograms of N‐glycans released from the cortex (b) and hippocampus (c) of AD (n = 5, red) and control (n = 5, blue) brains (with n referring to the number of individual cases included in the study). The profiles are markedly similar between AD and control brains while in hippocampus the AD and control profiles are slightly less similar