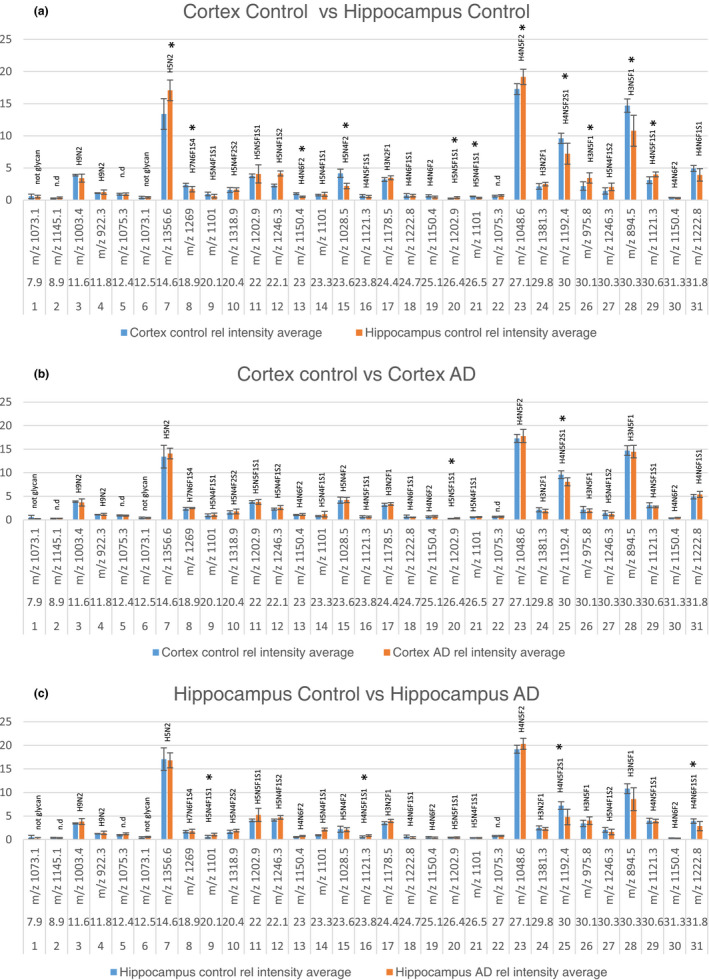
FIGURE 3.

The relative abundance of 31 extracted chromatogram (EIC) peaks was compared between control cortex (n = 5) and control hippocampus (n = 5) (a), control cortex (n = 5) and AD cortex (n = 5) (b) and control hippocampus (n = 5) and AD hippocampus (n = 5) (c) (with n referring to the number of individual cases included in the study). The graphs show EIC # (number), elution time (minutes), and m/z value for each peak. Error bars denote the standard deviation from five biological replicates. Starred peaks denote significant differences between the groups tested with student's T‐test
