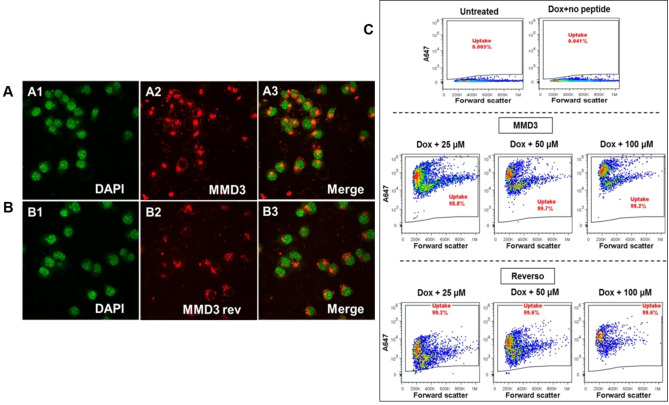
Figure 8.
Uptake of fluorescently labelled D‐peptides analyzed by confocal microscopy and flow cytometry. At different concentrations (25, 50 and 100 μM) of fluorescently labelled peptides (MMD3 and MMD3 reverse) were incubated with N2a cells expressing TauRDΔK for 48 h. The uptake of A647 peptides were analyzed by confocal microscopy (A, B) and by flow cytometry (C). As shown in the representative images the peptides are predominantly localized in the cytoplasm. A1, B1: DAPI shown as green; A2, B2: A647‐MMD3, A647‐MMD3 reverse; A3, B3: merged images. (C) The uptake of A647 labelled peptides were monitored by flow cytometry. As shown in the representative flow cytometry data, almost 100 % of the cells take up both the peptides. MMD3 reverse peptides show concentration dependent increase in intensity the fluorescence.

