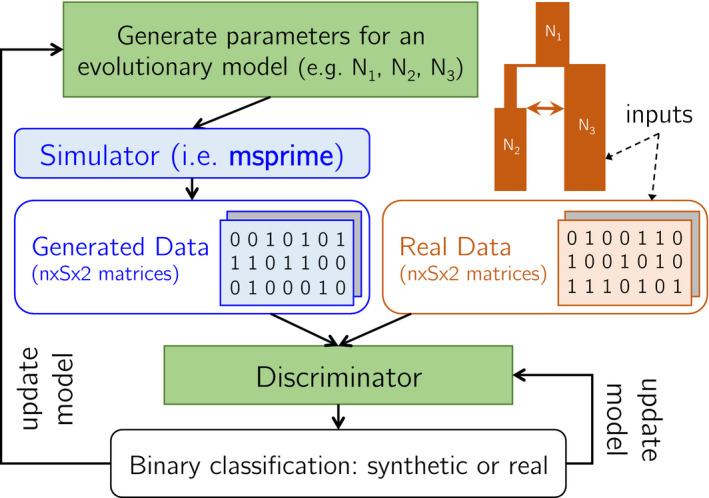
FIGURE 1.

pg‐gan algorithm overview. The inputs to our method are an evolutionary model and a set of real data (orange). The parameters of the generator and discriminator (green) are updated in a unified training framework using simulated annealing (generator) and backpropagation (discriminator). The generated data and real data are analysed one genotype matrix at a time, where is the number of haplotypes and is the number of SNPs retained in each region. Inter‐SNP distances are also fed in as a second channel, which provides the discriminator with information about SNP density
