
FIGURE 2.
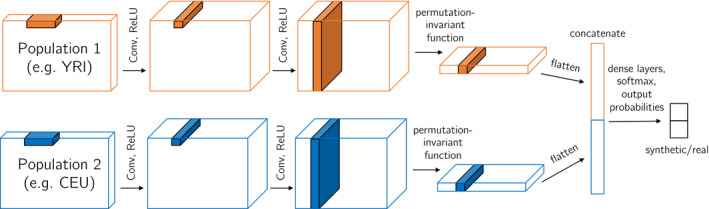
Multi‐population CNN discriminator architecture. Each example region is of shape , where is the number of haplotypes (usually with from population 1 and from population 2). The convolutional filters for population 1 and 2 are shared (i.e. not separate weights) so that haplotype commonalities can be more easily identified. The final output of the discriminator is the probability the region is real (which can be subtracted from 1 to find the probability the region is simulated). This CNN can be reduced for one population or extended for three populations