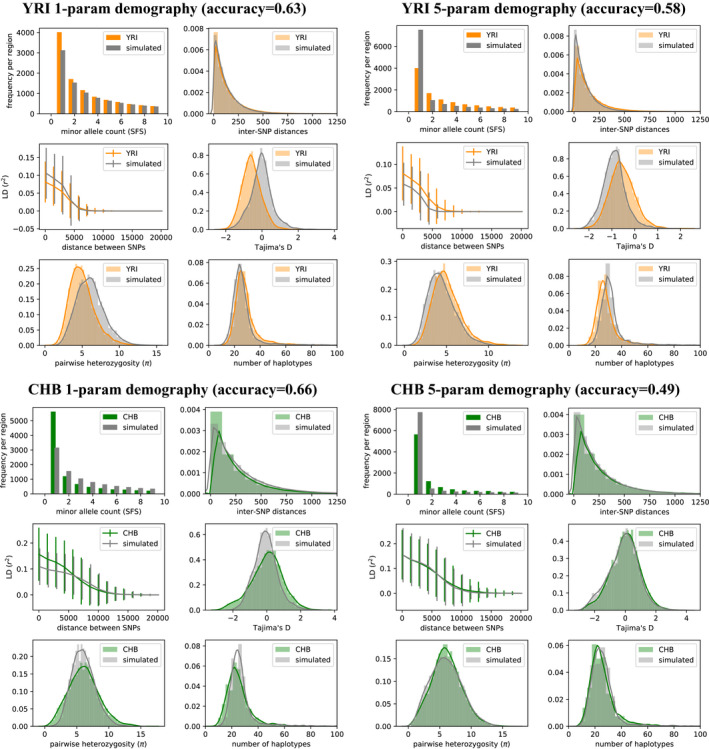
FIGURE 7.

Single‐population model. Summary statistic comparisons between 1000 Genomes Project data and data simulated under our pg‐gan inferred parameters for a variety of scenarios. Top left: YRI vs. data simulated under the one‐parameter constant population size model. Simulated accuracy: 0.52, overall accuracy: 0.63. Top right: YRI vs. data simulated under the five‐parameter exponential growth model. Simulated accuracy: 0.72, overall accuracy: 0.58. Bottom left: CHB vs. data simulated under the one‐parameter constant population size model. Simulated accuracy: 0.68, overall accuracy: 0.66. Bottom right: CHB vs. data simulated under the five‐parameter exponential growth model. Simulated accuracy: 0.54, overall accuracy: 0.49
