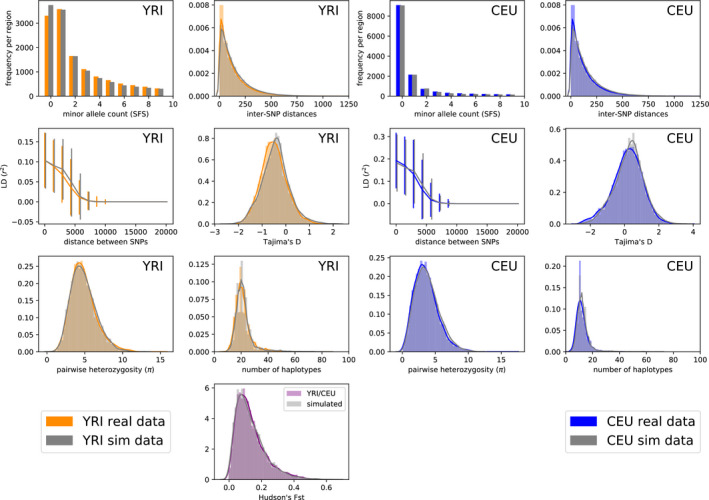
FIGURE 9.

YRI/CEU: two‐population model. Summary statistic comparison real 1000 Genomes data and data simulated under the inferred parameters from Table 4 (first row). Left: statistics computed on YRI samples only. Right: statistics computed on CEU samples only. Sites with count zero are segregating in only one population. between the two populations is shown in the bottom panel. Simulated accuracy: 0.68, overall accuracy: 0.54
