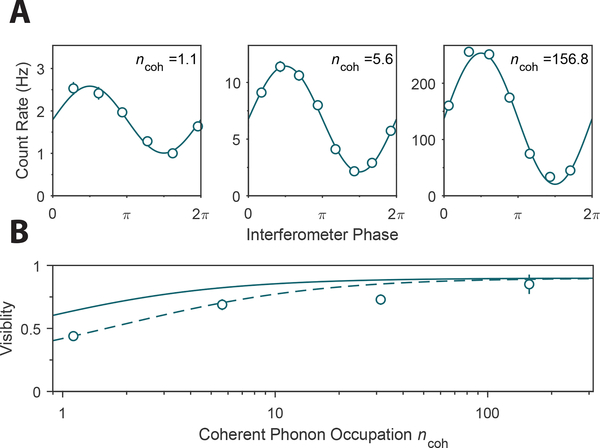
FIG. 4. Preservation of phase coherence during transduction.
(A) Interference patterns taken at different values of ncoh. The solid curves are sinusoidal fits to the data, from which we extract the visibility. (B) Visibility as a function of the coherent phonon occupation in the mechanical resonator. The error in the visibility for the lower values of ncoh are smaller than the data point size. The data is overlaid with the expected visibility from the coherent and noise contributions . The solid line considers thermal noise only (nnoise = nth), while the dashed line also takes any other sources into account (nnoise = nth + nother), while both are scaled by the maximum available visibility in our setup.

